PGO works best for code with many frequently executed branches that are difficult to predict at compile time. An example is the code with intensive error-checking in which the error conditions are false most of the time. The "cold" error-handling code can be placed such that the branch is rarely predicted incorrectly. Minimizing "cold" code interleaved into the "hot" code improves instruction cache behavior.
Also, the use of PGO often enables the compiler to make better decisions about function inlining, thereby increasing the effectiveness of IPO.
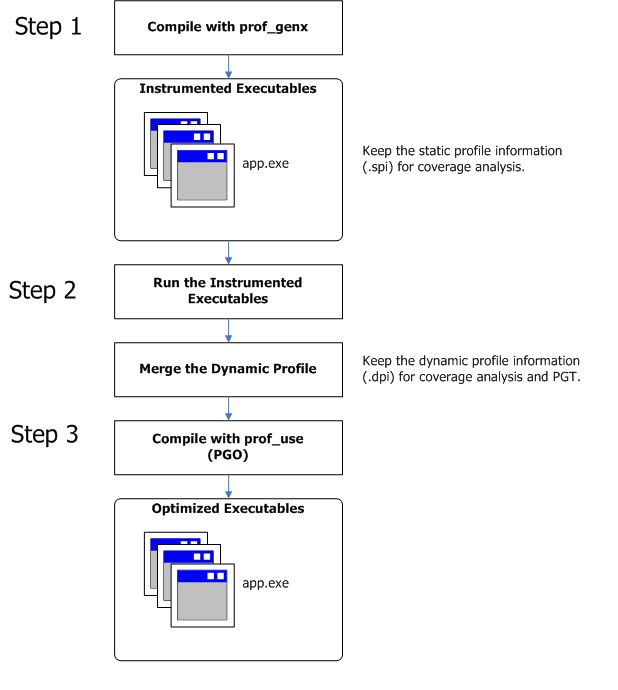
The PGO methodology requires the following three phases and options:
Phase 1: Instrumentation compilation and linking with the -prof-gen (Linux*) or /Qprof-gen (Windows*) option
Phase 2: Instrumented execution by running the executable, which produced the dynamic-information (.dyn) files
Phase 3: Feedback compilation with the -prof-use (Linux) or /Qprof-use (Windows) option
The flowchart (below) illustrates this process for IA-32 compilation and Itanium®-based compilation.
A key factor in deciding whether you want to use PGO lies in knowing which sections of your code are the most heavily used. If the data set provided to your program is very consistent and it elicits a similar behavior on every execution, then PGO can probably help optimize your program execution. However, different data sets can elicit different algorithms to be called. This can cause the behavior of your program to vary from one execution to the next.
In cases where your code behavior differs greatly between executions, PGO may not provide noticeable benefits. You have to ensure that the benefit of the profile information is worth the effort required to maintain up-to-date profiles.
Linux* systems: When using -prof-gen with the x qualifier, extra source position is collected which enables code coverage tools, such as the Intel® compiler Code-coverage Tool. Without such tools, -prof-gen (Linux) or /Qprof-gen (Windows) does not provide better optimization and may slow parallel compile times.
See Example of Profile-Guided Optimization for specific details on working with each phase.
The following figure illustrates the PGO usage model.