In a multi-threaded application, a thread is considered active when it is either running on a processor or waiting in the operating system (OS) scheduler run-queue.
A thread is not considered active when it is waiting for an external event (blocking), waiting for another thread, or spin waiting.
Instructions with explicit memory operands reference the segment containing the operand and the displacement from the beginning of the segment to the operand.
The offset is calculated as follows:
Base + (Index * Scaling Factor) + Displacement
Where:
Base Register can be any of the eight general registers: EAX, EBC, ECX, EDX, EBP, ESP, ESI, and EDI.
Index Register can be one of these general registers: EAX, EBC, ECX, EDX, EBP, ESI, and EDI.
Scaling Factor can be 1, 2, 4, or 8.
Displacement can be none, an 8-bit number, or a 32-bit number.
On the Pentium(R) processor and on the Pentium processor with MMX(TM) technology support, an Address Generate Interlock (AGI) conflict occurs when a register that is used as the base or index component of an effective address calculation was the destination register of an instruction executed in the immediately preceding cycle.
On the Intel486(TM) processor, AGI conflicts occur when a register that is used as the base (not the index) component of an effective address calculation was the destination register of an instruction executed in the immediately preceding cycle.
A possible solution or workaround recommended (usually a suggestion to modify the code) to remove or avoid a performance problem.
Alignment of data concerns all kinds of variables:
dynamically allocated
members of a data structure
global or local variables
parameters passed on the stack.
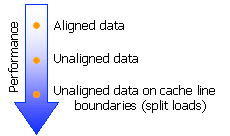
A misaligned data access can incur significant performance penalties. This is particularly true for cache line splits. The size of a cache line is 64 bytes in the Pentium(R) 4 processor, and is 32 bytes in Pentium III and Pentium II processors. On the Pentium 4 processor, an access to data that are unaligned on 64-byte boundary lead to two memory accesses and requires several micro-ops to be executed instead of one. Accesses that span either 16-byte or 64-byte boundaries are likely to incur a large performance penalty, since they are executed near retirement, and can incur stalls that are on the order of the depth of the pipeline.
Assembly/Compiler Coding Rule 15. (H impact, H generality) Align data on natural operand size address boundaries
For best performance, align data as follows:
Align 8-bit data at any address.
Align 16-bit data to be contained within an aligned four byte word.
Align 32-bit data so that its base address is a multiple of four.
Align 64-bit data so that its base address is a multiple of eight.
Align 80-bit data so that its base address is a multiple of sixteen.
Align 128-bit data so that its base address is a multiple of sixteen.
A 64-byte or greater data structure or array should be aligned so that its base address is a multiple of 64. Sorting data in decreasing size order is one heuristic for assisting with natural alignment. As long as 16-byte boundaries (and cache lines) are never crossed, natural alignment is not strictly necessary, though it is an easy way to enforce this.
A parameter value used to invoke the source code advice.
When the hardware needs the assistance of micro-code to deal with some event, the machine takes an assist. One example of such situation is an underflow condition in the input operands of a floating-point operation. The hardware must internally modify the format of the operands in order to perform the computation. Assists clear the entire machine of micro-ops before they begin to accumulate, and are costly. The assist mechanism on the Intel(R) Pentium(R) 4 processor is similar in principle to that on the Pentium II processors, which also have an assist event.
A group of consecutive instructions, which has only one entry point and one exit.
A register used to compute an effective memory address. It may be any of the eight general registers: EAX, EBC, ECX, EDX, EBP, ESP, ESI, and EDI. A base represents an indirect offset to an operand. The base register can be used alone (without an index or displacement) for dynamic storage of variables and data structures.
In the Thread Profiler, time when the thread is not active due to a blocking operation done while the thread was on the critical path. A blocking operation is one that blocks or stalls a thread when the thread invokes that operation, causing the thread to be inactive for the duration of the operation.
Examples of blocking operations are sleeps, waiting on the operating system for I/O operations (disk or file access or user input) to complete. Time may be classified as Blocking time if waiting for another thread or event (waiting for a signal) if the signal was lost or Thread Profiler does not know about the signal. If the User-Synchronization APIs were used, the thread might be actively spinning but would still be considered to be blocked when it is waiting for a signal that it lost or if it cancelled its prepare().
Branch mispredictions incur a large penalty on microprocessors with deep pipelines. In general, the direction of branches can be predicted with a high degree of accuracy by the front end of the Intel(R) Pentium(R) 4 processor, such that most computations can be performed along the predicted path while waiting for the resolution of the branch.
In the event of a misprediction, instructions and micro-ops that were scheduled to execute along the mispredicted path must be cancelled. These instructions and micro-ops are referred to as bogus instructions and bogus micro-ops. A number of Pentium 4 processor performance monitoring events, for example, instructions retired and mops retired, can count instructions or micro-ops that are retired based on the characterization of bogus versus non-bogus.
In event description tables, the term bogus refers to instructions or micro-ops that must be cancelled because they are on a path taken from a mispredicted branch. The terms retired and non-bogus refer to instructions or micro-ops along the path that results in committed architectural state changes as required by the program execution. Thus instructions and micro-ops are either bogus or non-bogus, but not both.
A small cache where the processor stores information about previous branches. The processor uses the information stored in the BTB to predict whether or not a branch that it encounters should be predicted as being taken or not-taken.
The ratio of the processor clock to the bus clock.
A small, fast memory which holds the active parts of a larger, slower memory. Caches raise system performance by satisfying an internal read request more quickly than a bus cycle to memory. They also reduce the processor's use of the external bus when the same locations are accessed multiple times.
A cache miss is a request for memory that is not found in the cache. When a cache miss occurs, the processor fetches an entire 32-byte line from a higher level cache (L2) or, if necessary, from main memory. If necessary, it replaces the least recently used (LRU) line.
There are three types of cache miss:
A compulsory miss on the first access to a specific memory address that is not in the cache.
A conflict miss occurs in a set-associative cache when all lines in a given set are full.
A capacity miss occurs when all sets in the cache are full.
Maximum of child nodes to display.
A capacity miss is a request that misses the cache because the cache was full.
An instruction that breaks down into more than four micro-ops, or is longer than seven bytes. Only decoder D0 can decode complex instructions. Complex instructions cannot be decoded in parallel with other instructions.
Examples of instructions that break down into more than four micro-ops are CALL, RET, CMPXCH, LOCK, and CPUID.
Instructions with both an immediate operand and a displacement, as shown below, are also complex because they are longer than seven bytes:
movzx ebx, word ptr [ecx] + 077fb7426
lea ecx, dword ptr [esi*02] + 0
A request that misses because it is the first reference to a given line in memory. A compulsory miss always occurs when it is the first reference to a given line in memory.
A request that misses due to lack of space in a certain set. A set is a group of lines in the cache into which a given line in memory can be mapped. The number of lines per set depends on the associativity of a cache. A cache with two lines per set is called a two-way set associative cache.
Sub-graphs where an undirected path exists between all pairs of nodes. If no path exists between two nodes in a graph, then those two nodes must belong to different connected components.
A correct multithreaded program is free of race conditions that could lead to non-deterministic results.
The mask that determines when the event counter increments. This corresponds to bits 24 through 31 of the 32-bit Event Select register that controls the performance monitoring counter. When non-zero, the processor compares this mask to the count of events during a single cycle. If the event count is greater than or equal to this mask, the counter is incremented by one. Otherwise the counter is not incremented.
This mask can be used to count events only if there are multiple occurrences per clock (for example, two or more instructions retired per clock). If the counter-mask field is 0, the counter is incremented each cycle.
Cycles per instructions retired. This event ratio is a basic measure of performance.
The act of one processor writing data into the currently executing code segment of a second processor with the intent of having the second processor execute that data as code.
A situation where the order in which two accesses occur is not guaranteed by the program, causing indeterminate results. A data race is due to two different threads accessing the same memory location at the same time without the proper synchronization needed to guarantee consistent results.
A thread is deadlocked when it is waiting for a critical section, mutex, or thread handle that can never be acquired.
For example, if two threads each hold a different mutex and need the mutex held by the other thread to proceed, the threads are deadlocked since neither thread can give up the mutex it already holds nor acquire the second mutex.
The part of the processor that breaks instructions into sequences of simple micro operations, known as micro-ops. Each micro-op has two logical sources and a logical destination.
A relationship between two instructions such that one instruction uses the other's result or defines the other's operands. The compiler cannot reschedule dependent instructions.
For example, a compiler cannot move an instruction to load above an instruction to store a because the two instructions use the same variable a and are dependent on each other.
Tiny numbers represented by making the integer bit (and perhaps other leading bits) of the significand zero. The use of leading zeros with denormalized numbers allows smaller numbers to be represented. However, this denormalization causes a loss of precision (the number of significant bits in the fraction is reduced by the leading zeros).
Nodes that have no edges connected to them.
Dynamic branch prediction is used to update the instruction pointer (IP) early (during instruction fetch, instead of during decoding). As a result, fewer instructions enter the pipeline that will need to be flushed.
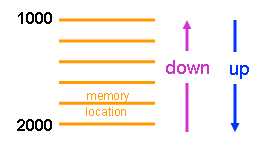
Prefetching can be done in an upward or downwards direction, as illustrated.
A relationship between two functions where one (caller) is calling the other (callee).
Time (microseconds) contributed to the total time of a callee function when called from a specific caller function. The sum of the edge time of all the incoming edges to a function equals to this function's total time.
The execution time (microseconds) of a particular function when called from a specific parent function.
Time (microseconds) contributed to the total wait time of a callee function when called from a specific caller function. The sum of the edge wait time of all the incoming edges to a function equals to this function's total wait time.
Event skid is the recording of an event not exactly on the code line that caused the event. Event skids may even result in a caller function event being recorded in the callee function.
Event skid is caused by a number of factors:
The delay in propagating the event out of the processor's microcode through the interrupt controller (APIC) and back into the processor.
The current instruction retirement cycle must be completed. For example, on the Pentium(R) Pro processor family, up to three instructions can be retired in a single clock.
When the interrupt is received, the processor must serialize its instruction stream which causes a flushing of the execution pipeline.
The Intel(R) Pentium(R) 4 or Itanium(R) processors support accurate event location for some events. These events are called precise events.
Example: Interpreting Jump and Call Instructions
Events that happen in the execution time of the jmp or call instruction, may appear on instruction that is one or two instructions away from original jmp/call in the execution flow. In this example, the mov instruction at the top of the loop is not responsible for the 1.02% of the events because the mov instruction is the target of the branch at the bottom of the loop. The real source of the events is the jmp instruction at the bottom of the loop.
Event % |
Instructions |
|
1.02% |
top_of_loop: mov ... ... (any number of lines) end_of_loop: jnz <to someplace> jmp top_of_loop |
Synchronous events which are responses of the processor to certain conditions detected during the execution of an instruction. It can also be defined as a forced call to a procedure or a task which is generated when the processor fails to interpret an instruction or when an INT n instruction is executed. Causes of exceptions include division by zero, stack overflow, undefined opcodes, and memory protection violations.
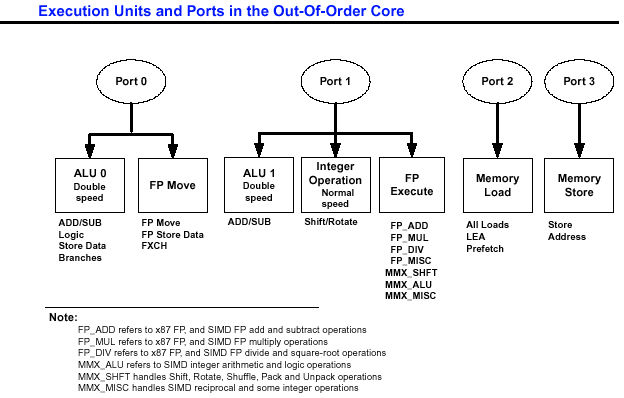
For IA-32 processors, the names of the execution units in the execution core that are utilized to execute the micro-ops for each instruction. This information is provided only for IA-32 instructions that are decoded into no more than 4 micro-ops or instructions that decode into more than 4 micro-ops are supplied by micro-code ROM.
Several execution units may share the same port, such as FP_ADD, FP_MUL, or MMX_SHFT in the FP_EXECUTE cluster.
An Address Generate Interlock (AGI) conflict occurs when a register that is used as the base or index component of an effective address calculation was the destination register of an instruction executed in the immediately preceding cycle. An explicit AGI conflict occurs when the previous instruction explicitly wrote to the destination register. For example, add eax, 3 explicitly writes to the eax register.
A function selected in the function summary, or in the graph view.
Eight general registers that hold operands for logical and arithmetic operations: eax, ebc, ecx, edx, ebp, esp, esi, and edi.
Some hotspots may turn out to be bottlenecks but some other hotspots, by the very nature of their content inevitably take a long time to execute. These sections of code may be essential to the running of your program. You cannot, therefore, remove such hotspots. Focus on the hotspots that are bottlenecks and can be removed through optimization of your code or system.
Intel(R) processors are superscalar, enabling them to execute more than one instruction per clock cycle. Intel Hyper-Threading technology extends this capability by making a single physical processor appear to be two logical processors that are capable of executing two threads in parallel. From a software perspective, operating systems and programs can schedule processes or threads as if they were running on two physical processors. From a microarchitecture perspective, instructions from two logical processors execute simultaneously on the shared resources of one physical processor, thus increasing overall resource utilization.
Operating environments can take advantage of Hyper-Threading technology in one of two ways.
First, applications can be multithreaded thus allowing the individual application to execute upon parallel threads in the processor at the same time. Operating systems like Microsoft* Windows* Server 2003 and Windows XP* along with high performance applications such as database engines, scientific computation programs and multimedia design software are currently multithreaded and are typically run in dual- or multi-processor environments.
Second, Hyper-Threading can be used in a multitasking environment where the system is running more than one application in parallel. In this instance, each application can be run as separate threads on the same processor increasing utilization of the execution units and overall platform performance.
A thread is idle when it is waiting on an object such that execution of its next operation is delayed.
The process in which the compiler moves instructions and reorders them in order to allow instructions to execute in parallel and to avoid stalls or wasted cycles between two dependent instructions.
An observation about the performance of your code. It could indicate a potential performance problem that could be a bottleneck to your applications performance.
First-level on-die cache. The L1 cache is a small but very fast cache that has an instruction cache and a data cache, the first dedicated to caching instructions and the other to caching data.
L1 Instruction and Data Cache Characteristics:
L1 Instruction Cache |
|
L1 Data Cache |
|
L2 cache misses have a much greater impact on performance than L1 cache misses, and L2 cache problems are often easier to solve than L1 cache problems.
Second-level cache. While the L1 cache is an on-chip cache, the second-level cache (L2 cache) is located between the on-chip cache and the main memory. It is located on a separate die and closely coupled to the CPU die by means of a dedicated full clock-speed bus.
If an access misses the L1 cache, the access passes on to the bigger, but slower L2 cache. The L2 cache is a unified cache of both instructions and data. If the access misses the L2 cache, it goes to the main memory.
L2 Cache Characteristics:
L2 Unified Cache |
|
In the Pentium(R) processors, the L2 cache is external to the processor package and optional; in the Pentium 4 and P6 family processors, the L2 cache is internal to the processor package.
L2 cache misses have a much greater impact on performance than L1 cache misses, and L2 cache problems are often easier to solve than L1 cache problems.
The number of clock cycles an instruction takes to calculate its result.
The smallest unit of storage that can be allocated in a cache. When the processor fills a cache line, it loads the entire cache line, using multiple read cycles to main memory.
For cache line lengths for different processors, see L1 cache and L2 cache.
Loads on unaligned data reduce performance. Loads on data that crosses cache line boundaries reduce performance even more.
A synchronization object with ownership. For example a critical section or mutex can be owned by a thread in contrast to a semaphore, which is an un-owned object.
The order in which a thread acquires multiple locks to be held simultaneously. All threads that acquire the same locks should acquire them in the same order to avoid deadlock.
Loop blocking is structuring code so that it performs several operations on blocks of data of a large matrix (while the data is still in the cache), instead of trying to process each operation separately on all the elements, one at a time.
This enables more work to be done on the same data while it is still in the cache.
A variable value that does not change within a loop.
Last recently used.
The path that takes maximum time.
The most time-consuming path that leads from the function down to the end of the graph.
The most time-consuming path that leads from the root down to the function.
The most time-consuming path that leads from the root down to the function.
A memory subsystem that acts as a reservation station and a reorder buffer. It holds suspended loads and stores, re-dispatching them when the blocking condition (dependency or resource) disappears.
The combination of two or more VTune(TM) Performance Analyzer Activity results into one virtual Activity result.
A decoded series of micro-operations produced by processor decoders from a stream of Intel(R) architecture instructions. Every assembly instruction can break into one or more micro-ops.
MMX(TM) Technology:
Introduces 64-bit MMX registers.
Introduces support for SIMD operations on packed byte, word, and doubleword integers.
The MMX instructions are useful for multimedia and communications software. The eight MMX registers support execution of single-instruction, multiple-data (SIMD) operations on 64-bit packed byte, word, and doubleword integers.
For more information on the MMX technology, refer to the IA-32 Intel(R) Architecture Software Developer's Manual, Volume 1. See the Intel(R) Processor Information on the Web for more details.
The data collector temporarily stores the module records (executables and DLLs that are loaded) during the sampling process in the module buffer. When the buffer is full, the data collector flushes buffer to the result file. A small Module Buffer Size can cause the data collector to frequently flush the buffer to file, which can negatively impact system performance.
A multi-threaded program allows different parts of a program to run concurrently. Operating systems like Microsoft* Windows* Server 2003 and Windows XP* are multi-threaded as are many scientific applications. When creating an application, developers must create code so that the threads can run independently and will not interfere with each other.
A synchronization object used to allow multiple threads to serialize their access to shared data. The name derives from the capability it provides; namely, mutual-exclusion. The thread that has locked a mutex becomes its owner and remains the owner until that same thread unlocks the mutex.
See bogus, non-bogus, retire events.
A process that does not slow down the applications running on a system. For example, sampling is non-intrusive since it takes less than 5% of processor time during an Activity. It also does not modify binary files or executables (no instrumentation of code as in call graph).
A specific collection of counters that relate to a specific application, OS subsystem, or hardware device. A software object is a collection of counters that originate from a software component of the system such as an OS subsystem. A hardware object is a collection of counters tracked by the counter registers on a hardware device in the system such as the microprocessor. Each object has a unique set of counters associated with it.
An application has more active threads than the number of available processors.
A microarchitecture design technique, also called the superscalar architecture, that divides the execution of an instruction into sequential steps, using different microarchitectural resources at each step. Pipelined machines have multiple Intel(R) architecture instructions executing at the same time, but at different stages in the machine.
The Pentium(R) and Pentium Pro family processors achieve high execution speed through the superscalar architecture. The Pentium processor has two execution units (U and V pipes) and can process two instructions per clock, so it is superscalar level 2. The Pentium Pro processor can dispatch and retire three instructions per clock so it is superscalar level 3.
Precise events are events for which the exact instruction addresses that caused the event are available. Some events for the Pentium(R) 4 processor are precise events.
The Intel NetBurst(R) microarchitecture supports three prefetching mechanisms:
the first is for instructions only
the second is for data only
the third is for code or data
The first mechanism is hardware instruction fetcher that automatically prefetches instructions. The second is a software controlled mechanism that fetches data into the caches using the prefetch instructions. The third is a hardware mechanism that automatically fetches data and instructions into the unified second-level cache. The hardware instruction fetcher reads instructions along the path predicted by the BTB into the instruction streaming buffers. Data is read in 32-byte chunks starting at the target address.
Prefixes are one or more bytes that precede an instruction and modify the operation of the instruction.
Variable (or memory addresses) that is designed to be only visible to one thread. For example, a variable declared on a thread's stack is usually visible only to the thread that declared it.
An executing application which has a specific reserved virtual address. It is an intrinsic combination of code, data and several operating system resources. During execution it can contain one or more threads that run parallel.
Contains Activities and Activity results. The project is contained in a .vpj project file.
A recursive function is a function that directly or indirectly calls itself.
The timing information formulas:
Total [Wait] Time = Self [Wait] Time + SUM (Outgoing Edge [Wait] Time)
Total [Wait] Time = SUM (Incoming Edge [Wait] Time)
do not work for functions found on a recursive path. The reason is the following: the values calculated on edges forming a recursive chain accumulate the circulating recursive calls. To find out whether the function is on a recursive chain, highlight Recursive functions on the filter toolbar.
For recursive functions, the following statements are true:
Total [Wait] Time <= Self [Wait] Time + SUM (Outgoing Edge [Wait] Time)
Total [Wait] Time < = SUM (Incoming Edge [Wait] Time)
Relative virtual address of any function in your program.
An heuristic to indicate how relevant a particular insight or advice is to the current context. For instance, an extremely high relevance score for an insight may indicate a high probability of a performance bottleneck.
In order to maximize performance for the common case, the Intel NetBurst(R) microarchitecture sometimes aggressively schedules micro-ops for execution before all the conditions for correct execution are guaranteed to be satisfied. In the event that all of these conditions are not satisfied, micro-ops must be reissued. This mechanism is called replay.
Some occurrences of replays are caused by cache misses, dependence violations (for example, store forwarding problems), and unforeseen resource constraints. In normal operation, some number of replays are common and unavoidable. An excessive number of replays indicate that there is a performance problem.
A resteer is a change in the Instruction Pointer (IP) beyond the normal increment to the next instruction bundle. Normally the IP increments to the next sequential instruction bundle. The IP is used to fetch instructions from the cache and/or memory, and then placed into the instruction pipeline for processing.
When a branch instruction is detected and predicted taken or if an exception or interrupt occurs, the IP is changed to a new value and instruction fetching begins at this new IP value. This change in IP to a different address that is not the next sequential instruction bundle is called a resteer.
See bogus, non-bogus, retire events.
Frequency with which the VTune(TM) Performance Analyzer interrupts the processor to collect samples.
Registers that hold segment selectors associated with different forms of memory access. There are six registers (CS, DS, SS, ES, FS, and GS) that determine, at any given time, which segments of memory are currently available.
Time (microseconds) spent inside a function, including time spent waiting between execution activities. It does not include time spent in calls to other instrumented functions.
The number of microseconds spent inside a function while its thread/fiber was non-active (suspended). Self Wait time does not include the non-active time spent in callees of the function.
The call graph calculation of the Self_Wait_Time is based on a heuristic estimation that tracks context switches caused by synchronization events and by other causes.
A signal used to govern access to shared system resources.
Variables or memory addresses that are designed to be visible to more than one thread. For example, global variables are usually visible to all threads and each thread may read or write the shared variable (address).
The three SIMD technologies that have been added to the IA-32 architecture in chronological order are as follows:
Streaming SIMD Extensions2 (SSE2)
A mechanism that checks whether the address presented is in the cache of the processor. If the address hits a modified line in the data cache, the modified line is written back onto the bus.
Threads that are prevented from running, typically because they are waiting for locks to be released or for other operations to complete.
The number of seconds for which sampling is delayed after you start an Activity.
Streaming SIMD Extensions:
Introduces 128-bit XMM registers.
Introduces 128-bit data type with four packed single-precision floating-point operands.
Introduces data prefetch instructions.
Introduces non-temporal store instructions and other cacheability and memory ordering instructions.
Adds extra 64-bit SIMD integer support.
The SSE instructions are useful for 3D geometry, 3D rendering, speech recognition, and video encoding and decoding.
For more information on the Streaming SIMD Extensions, refer to the IA-32 Intel(R) Architecture Software Developer's Manual, Volume 1.
SSE was followed by Streaming SIMD Extensions2 (SSE2).
Wait time where the threads do not perform any work due to locks being held by other threads. The time spent by the thread waiting in the blocked queue in the OS scheduler waiting for an opportunity to run. This opportunity becomes available when a thread currently holding the lock releases it.
An object, such as a mutex, critical section, semaphore, event or handle of a thread used to control or limit access to a section of code. In the Windows* API, synchronization objects except critical sections, are referenced by HANDLE.
Tagging is a means of marking micro-ops to be counted at retirement. See Appendix A of the IA-32 Intel Architecture Software Developer's Manual, Volume 3: System Programming for the description of the tagging mechanisms. See the Intel(R) Processor Information on the Web for more details.
The same event can happen more than once per micro-op. The tagging mechanisms allow a micro-op to be tagged once during its lifetime. The retired suffix is used for metrics that increment a count once per micro-op, rather than once per event. For example, a micro-op may encounter a cache miss more than once during its life time, but a Misses Retired metric (for example, 1 st -Level Cache Misses Retired) will increment only once for that micro-op.
The target number of samples is calculated by multiplying the samples per second (the inverse of the Sampling Interval) by the Duration.
A thread is part of a program that can be run independently of other aspects of the program.
This event is logical processor independent. The sample count measured is the total number of events that occurred on the physical processor package. The event interrupt for thread independent events is set on logical processor 0. Sample counts for the total system are accurate by physical processor package. However, sample counts at a particular IP address at the process, module, function, or source code may not be accurate. That is because sample counts on logical processor 1 at a particular IP address will be counted on logical processor 0 which is very likely to be at a different IP address. The IP address on logical processor 0 is recorded as the location of the event. If you use TI events, be aware of this when reviewing data below the system level.
This event is logical processor specific. However, do to an ESCR restriction that prevents both logical processors from being sampled in the same run, the event has been programmed to be thread independent. The sample count measured is the total number of events that occurred on the physical processor package. The event interrupt for thread independent events is set on logical processor 0. Sample counts for the total system are accurate by physical processor package. However, sample counts at a particular IP address at the process, module, function, or source code many not be accurate. That is because sample counts on logical processor 1 at a particular IP address will be counted on logical processor 0 which is very likely to be at a different IP address. The IP address on logical processor 0 is recorded as the location of the event. If you use TI-E events, be aware of this when reviewing data below the system level.
For IA-32 processors, number of clock cycles required to wait before the issue ports are free to accept the same instruction again. For many IA-32 instructions, the throughput of an instruction can be significantly less than its latency.
A form of sampling that collects information at a regular time interval and allows you to monitor all active software on your system, including the operating system, device drivers, and application software.
The floating-point register stack contains eight numeric registers, numbered ST(0) through ST(7). ST(0) is also called TOS. Most floating-point instructions require at least one operand in the TOS.
Time (microsecond) elapsed between the time a function starts execution until the time it terminates execution. This is the sum of this function's Self Time and all its callees Total Time.
This column shows the total of the Self_Wait_Time of the function and the Self_Wait_Time of all its children.
On-chip caches used to store the most recently used page table entries. Separate TLBs exist for data (DTLB) and instruction caches (ITLB). Most paging is done using the contents of the TLB.
The integer pipe on the Pentium
When an application does not fully utilize all the available processors in the system; the application runs with fewer threads than the number of processors.
Prefetching can be done in an upward or downwards direction, as illustrated.
All the software or a subset of the software that was executing when data was collected. This includes the application launched by the Analyzer and any child processes (modules of interest) the application launches.
A write request to a line in the cache updates only the data cache memory. Writes to lines in the memory are not immediately forwarded to main memory; instead they are accumulated in the cache. The modified cache line is written to main memory later when a write back occurs. Write-back operations are triggered when cache lines need to be deallocated, such as when new cache lines are being allocated in a cache which is already full. Write-back operations also are triggered by the mechanisms that are used to maintain cache consistency like snooping.
The write-back policy reduces bus traffic by eliminating unnecessary writes to memory.
Last updated: September 24, 2004